The NSBApp Debugger (AppStudio 4.2.2+) is based in the Weinre (“WEb INspector REmote”) app. It looks like a subset of the Chrome Debugger. That’s no surprise: both are based on the same Web Inspector software. This debugger does not have the ability to view code or set checkpoints, but otherwise is quite functional.
It’s a great way to debug your app when it running on an actual device.
Use it in the following cases:
1. Your app is running on an Android or iOS device as a web app, after having been loaded from nsbapp.com. It can be running in the browser or from the Home Screen.
2. Your app is running on an Android or iOS device as a native app after having been compiled by PhoneGap. The project property “NSBApp Debugger” must be set to True.
(We also have a complete guide to which debugger to use in each case).
To start it, select “NSBApp Debugger” from the Run menu in AppStudio, after the app has been started on your device. It works wirelessly: your device does not have to be physically connected to your desktop system.
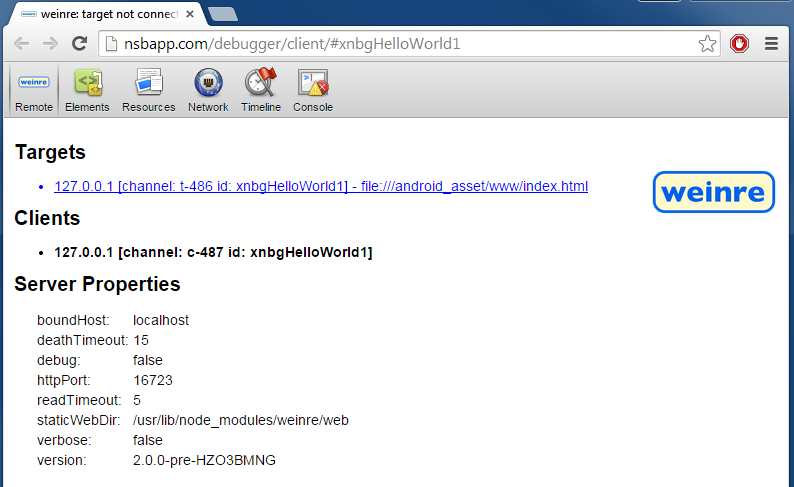
You’ll see this (we’re debugging a PhoneGap app on an Android device here):
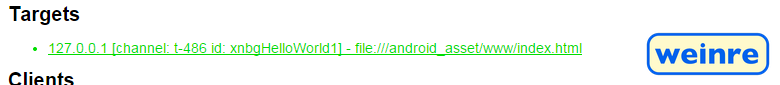
Click on the blue item. It will connect to that app and turn green:
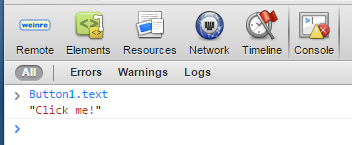
Now you can look at the Console and enter commands:
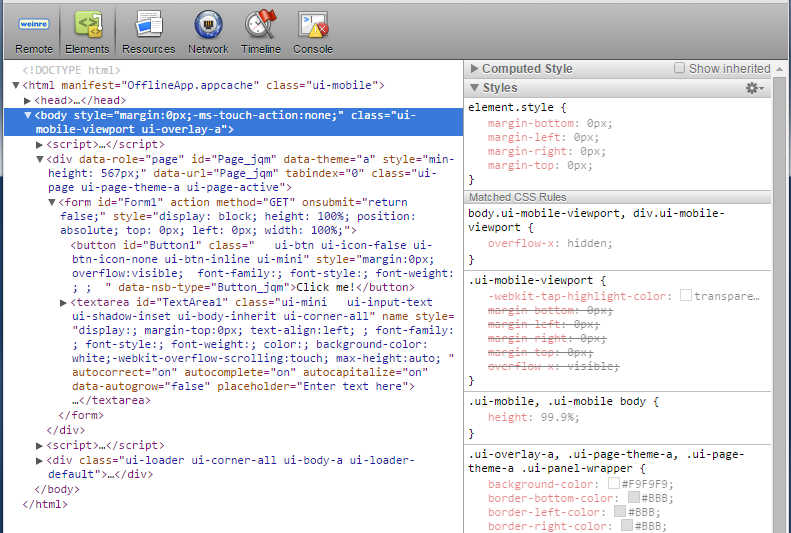
Or look at the Elements of your app: